


 he beginning of NMR was spectroscopy — which, at those times, was not yet called MRS. Today, for biological and medical applications one distinguishes MRI (imaging) and MRS (spectroscopy). Meanwhile, however, the heyday of medical whole-body MRS seems to have already passed.
MR spectroscopy has many useful applications, for instance checking if the wine in Figure 05-01 that you want to drink (or, if you rather prefer orange juice) has been adulterated or contaminated. This can be done with SNIF-NMR spectroscopy, which tells the specialist whether the juice (or wine) contains the sugars of a pure fruit juice or of added sugars. Unfortunately, we are more interested in medical applications of MR spectroscopy.
Figure 05-01:
Old wine bottles, covered with spider webs — most likely they contain an excellent red wine, or perhaps not?
MR spectroscopy was one of the major selling points for the introduction of high field MR machines at 1.5 Tesla in the early 1980s. The combination of imaging and spectroscopy was thought to yield greater diagnostic value. For some years, MRS developed to a favorite field of research at many places. Still, it never became really popular in clinical routine.
With the arrival of clinical systems operating at 3 Tesla, the industry expected a new boom of MRS. Yet, although many 3T machines have spectroscopic capabilities, about only one in twenty is used routinely to perform clinical or research spectroscopic studies.
Until now we have assumed that all protons in a human being resonate at the same resonance frequency in a given magnetic field. However, ¹H signals do not all come at the same frequency and so, for instance, the fat signal is generally shifted from its "correct" position.
Why does ¹H in water have a different resonance frequency to ¹H in fat?
Even though both protons are within the very large, uniform external magnetic field, they actually experience slightly different magnetic fields due to their chemical environments. Each proton is surrounded by other nuclei and electrons, all of which have a small magnetic field associated with them.
 It is the electrons in chemical bonds which are most significant in affecting the magnetic field experienced by a nucleus. Thus, a proton in water is mostly influenced by electrons in H-O bonds, a similar nucleus in fat by electrons in H-C bonds.
These differences in resonance frequency caused by the nuclei experiencing different chemical bonds are used for MR spectroscopy. The differences themselves are known as the chemical shift, δ (Figure 05-02).
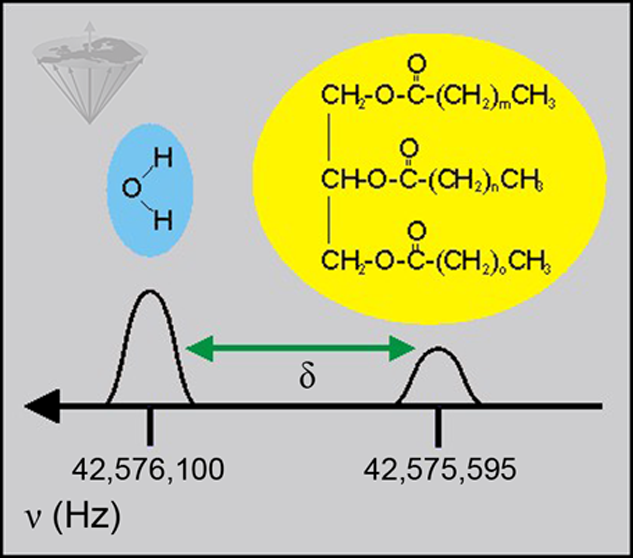
Figure 05-02:
Chemical shift (δ): A ¹H spectrum of tissues often reveals two clearly distinct peaks. One is assigned to tissue water, the other one to protons in lipids (in this case triglyceride). Data given in Hertz for 1.0 Tesla.
Chemical shift is simply a difference in frequency and is measured in Hz. The difference in frequency varies with magnetic field so that the chemical shift between water and fat is about 350 Hz at 2.35 Tesla, but about 700 Hz at 4.7 Tesla.
Fortunately, the change in the frequency difference is directly proportional to the change in the external magnetic field. If the chemical shift in Hz is divided by the basic resonance frequency of the nucleus in Hz, one obtains a number for the chemical shift, e.g., between water and fat, which is identical regardless of the strength of the applied magnetic field.
Chemical shifts are typically in the range of tens to hundreds of Hz, whereas the resonance frequencies are typically in the range of tens to hundreds of MHz. This makes the values of the chemical shifts rather small, so the numbers are always multiplied by one million and expressed in a parts-per-million scale, or ppm.
Some important abbreviations used in MR spectroscopy are listed in Table 05-01.
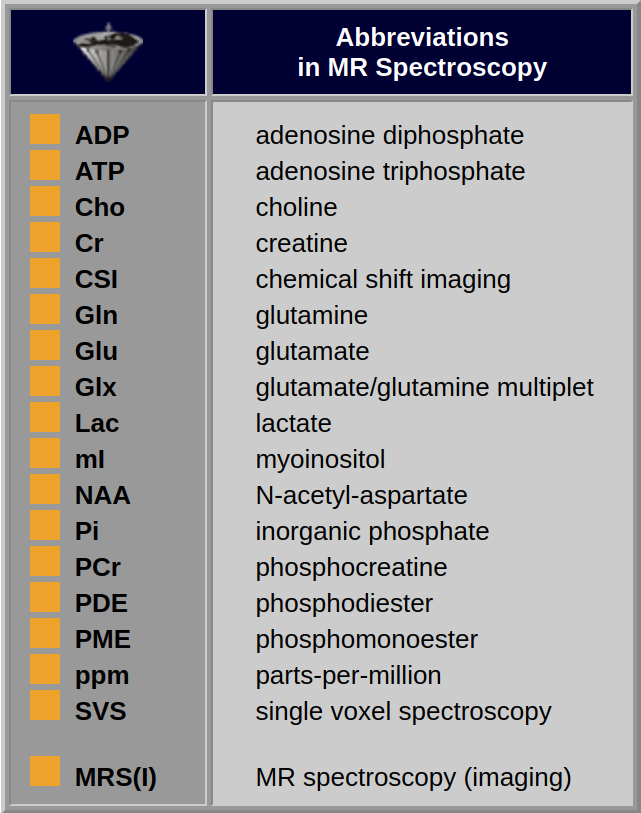
Table 05-01:
Some abbreviations frequently used in MRS.


|
Chapter 5 — Page 1 |

|
|---|