


 pin-echo sequences are not limited to a single 180° pulse and echo. Their advantages lie in the possibility to form a multitude of echoes by transmitting a train of 180° pulses. Thus, we can create a number of images with increasing TE values.
The best-known MSE sequence is the Carr-Purcell-Meiboom-Gill (CPMG) sequence.
Single and multiple SE sequences can be acquired in single-slice, multiple-slice and 3D modes.
Multislice imaging is limited by TE and TR. Its contrast is also influenced by the gaps between the slices and flow in vessels. In 3D imaging, the entire sample volume is excited simultaneously and slices are obtained by the use of an additional phase-encoding gradient. However, 3D imaging with an SE sequence is time-consuming and prohibitively long in clinical settings.
The efficiency of a multiecho sequence (MSE) is far higher than a single echo or an inversion-recovery sequence, both in terms of examination time and in the creation of contrast. They allow the creation of T1- and T2-dependent (T1- and T2-weighted) image contrast [⇒ Rinck 1983].
Multiple spin-echo data acquisition can be accelerated by Fast or Rapid Spin Echo (RSE) sequences (e.g., RARE). A further addition to the RSE armory can use longer echo trains (HASTE, GRASE, and similar sequences).
Rather than using the same amount of phase-encoding for each echo, and each echo as one line for an image associated with a particular TE, different amounts of phase-encoding can be applied. Thus, these echoes can be implemented as different lines in k-space in a single image.
The numbers of echoes per excitation which are incorporated into one image determine the time-saving factor of the sequence.
If one has a spin-echo sequence with a 256×256 image matrix and a data acquisition time of 256 seconds, in an RSE sequence with 8 echoes data acquisition will take 256/8 = 32 seconds; with 16 echoes, data acquisition will only take 256/16 = 16 seconds.
Multiple-slice sequences will take longer, according to the number of slices.
RSE sequences add two more parameters to TR and TE: the number of echoes per excitation (also called echo train length, TSE factor, or turbo factor) and the echo spacing. Since the echo time is close to a time average in RSE sequences, TE is called effective TE (Figure 10-06 and Table 10-04).
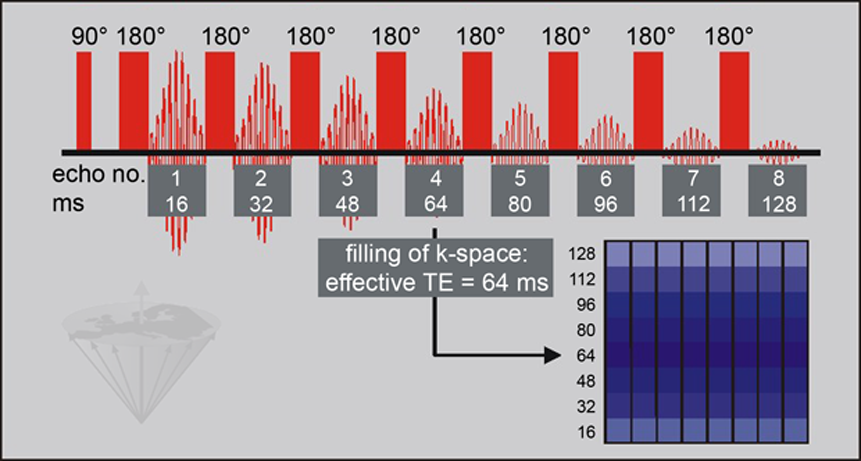
Figure 10-06:
A rapid spin-echo sequence utilizes an initial 90° pulse followed by multiple 180° refocusing pulses, producing an echo train. In our example, all echoes are used for one k-space. The echo with the 'effective TE' is assigned to the center slab of k-space and determines overall image contrast; the data of other echoes are placed in the slabs further away.
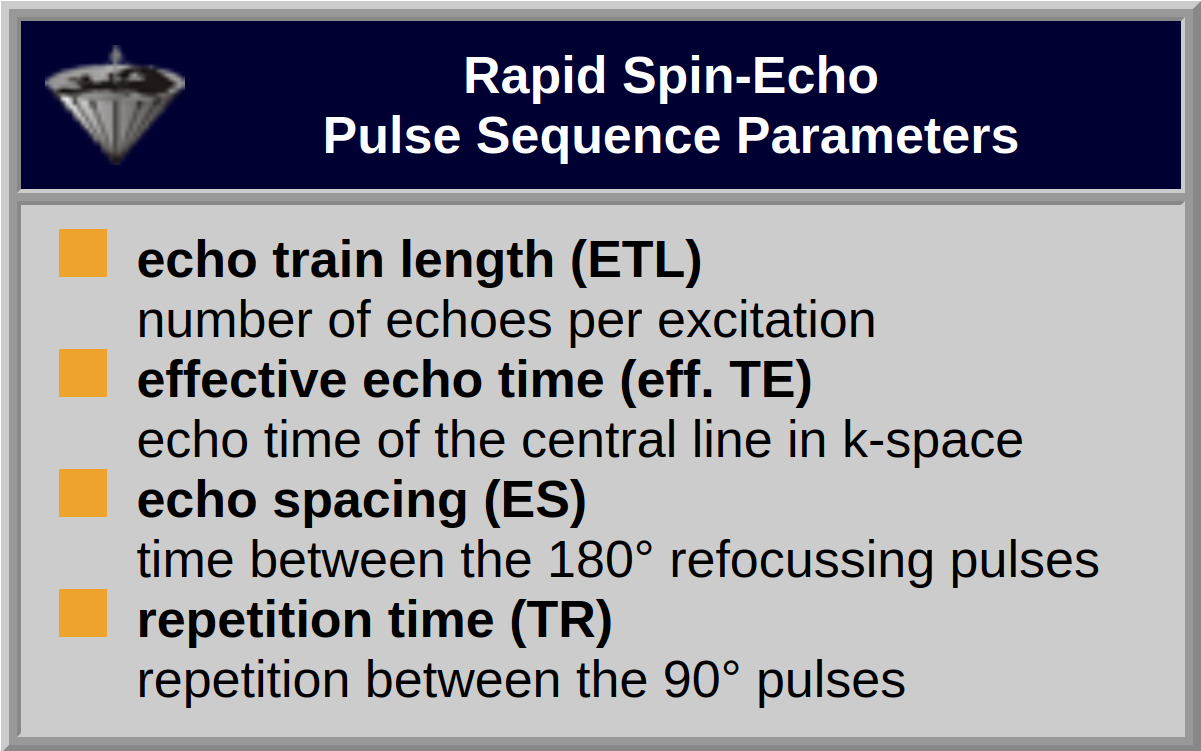
Table 10-04:
The pulse-sequence parameters of an RSE sequence are different from those of a conventional SE sequence (with the exception of TR).
It is not as obvious as with conventional imaging techniques what sort of contrast we can obtain in RSE sequences.
A straightforward signal-intensity calculation, similar to those in conventional 'pure' pulse sequences, is not possible.
Basically, the contrast in Rapid Spin Echo sequences depends on the order in which we apply the phase-encoding. Contrast manipulation is achieved by different ordering of the contributions in k-space; neither TR nor TE are changed, but different echoes are assigned to the reconstruction in k-space. Images can be proton density- or T2-weighted.
There is less speed advantage in T1-weighted RSE compared to conventional SE images; T1-weighted contrast can only be obtained through inversion recovery or partial saturation with the application of shorter TR.
However, for a large number of clinical questions ρ-weighted images can substitute T1-weighted images.
The trade-off of RSE is several, although subtle, differences in contrast, most importantly due to the different signal intensity of fatty tissues (Figure 10-07) [⇒ Henkelman 1992].
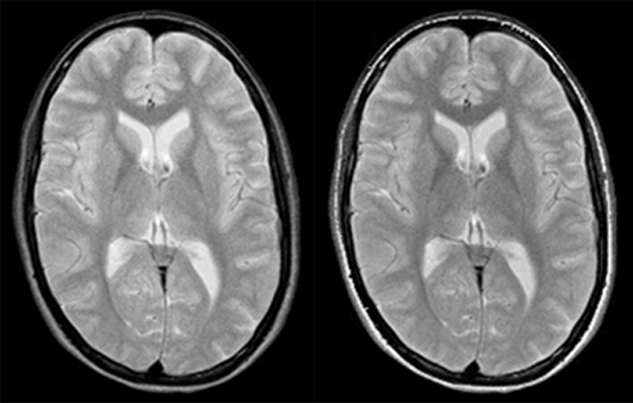
Figure 10-07:
Comparison of rapid spin echo and conventional spin echo.
Left: RSE: ETL = 8; eff. TE = 64 ms; ES = 16 ms; TR = 3000 ms
Right: SE: TE = 64, TR = 3000 ms.
With the exception of the signal from subcutaneous fat, contrast is very similar.
In RSE images, the lipid signal is usually higher than on similar SE images. This is claimed to be caused by several factors, including spin coupling among glyceride protons.
There are also magnetization-transfer phenomena that cause protein containing tissues to appear darker than on similar SE images, whereas hemorrhage with hemosiderin will appear less dark and CSF will appear relatively brighter, obliterating contrast between the ventricles and, e.g., periventricular multiple sclerosis plaques.
One also might exchange image sharpness for either enhanced or blurred edges, depending on whether k-space is acquired first or last.


|

|
|---|