


 unctional imaging is a misleading term because it is mainly used for the depiction of changes of local blood supply in the brain activated by specific stimuli. Commonly, dynamic or cine imaging of other organs or, e.g., joints are not described as functional MR imaging (fMRI). However, the term is not sharply defined, and sometimes diffusion, perfusion as well as brain activation studies are subsumed under fMRI. In contrast to EEG and MEG, functional MR imaging of the brain does not provide a direct measure of neural activity.
 In 1990, Belliveau and colleagues published the first observation of the stimulation of the human visual cortex by magnetic resonance imaging [⇒ Belliveau 1990].
They watched the first pass effect of a contrast agent after bolus injection to demonstrate changes in cortical perfusion upon activation with a photic stimulus. The use of bolus tracking to study changes in perfusion was an exact analog to previous experiments using the observation of radioactive tracers with PET or SPECT. It required the injection of a contrast agent in two consecutive scans, one with and one without stimulus.
The performance of such an experiment with MR has the advantage of vastly superior spatial and temporal resolution and the lack of radioactive tracers (cf. cerebral and regional cerebral blood-volume described in Chapter 16. However, the need for dual contrast agent injection poses a problem, especially for studies of brain activation in normal individuals.
This disadvantage was resolved by the demonstration of brain activation using the BOLD (blood-oxygen-level dependent) contrast mechanism first described by Ogawa [⇒ Ogawa 1990]. This technique has led to a fast proliferation of fMRI in hundreds of centers over the last decades.
The basis for BOLD-contrast was described by Pauling and Coryell in 1936 [⇒ Pauling 1936]. It relies on the fact that paramagnetic deoxyhemoglobin — by comparison to diamagnetic oxyhemoglobin — has a strong magnetic moment. Thus, by interaction of the bulk magnetization of deoxygenated blood with the external field, local field variations in and around blood vessels are created. These susceptibility effects can be measured using appropriate MR imaging sequences.
The only source of energy of normal brain cells is the oxidation of glucose. Since the glucose storage capacity of brain cells is negligible, the brain very heavily depends on a constant supply of glucose and oxygen via the capillary bed. This increased demand appears to lead to an increased amount of blood flowing to the activated area. This in turn decreases the local susceptibility effect, which can be visualized using appropriate susceptibility-sensitive imaging techniques (Figure 11-13).
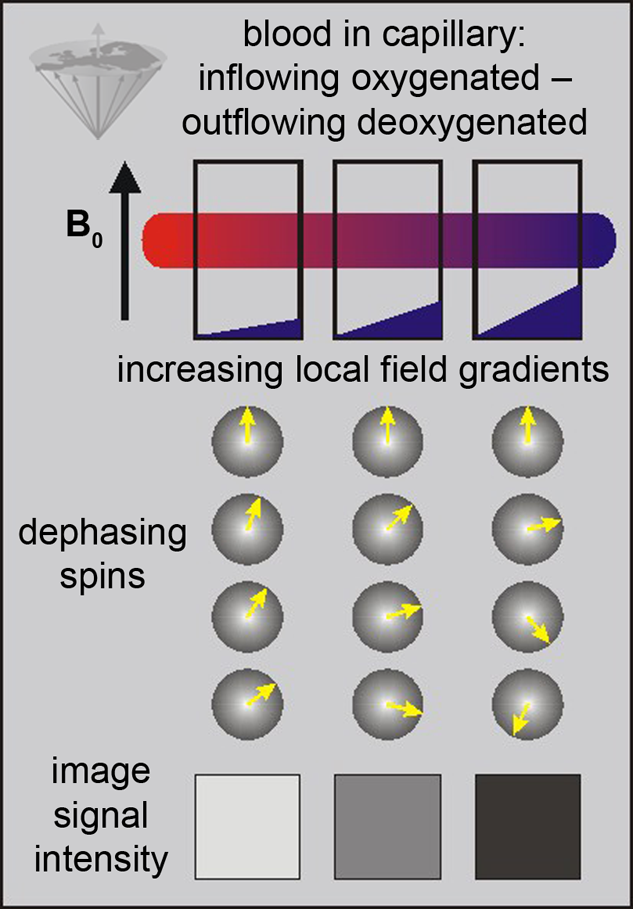
Figure 11-13:
BOLD-contrast. The presence of deoxyhemoglobin in a capillary causes a susceptibility difference between the blood vessel and the neighboring tissue. It induces a dephasing of the spins, thus a decrease in T2* and signal loss on T2-/T2*-weighted images.
Susceptibility differences are greater at higher fields, and thus higher fields are desirable for this kind of studies.
For the first human brain activation studies Kwong applied gradient-echo-planar imaging (GRE-EPI) [⇒ Kwong 1992]. The EPI sequence uses multiple gradient refocusing to acquire all data necessary for image reconstruction after a single excitation pulse. In spite of its not very well defined signal behavior, EPI has turned out to be a very efficient technique for brain activation studies due to its short acquisition time.
Conventional gradient-echo imaging with long echo times (40-60 ms, depending on field strength) has also turned out to be a useful technique for fMRI [⇒ Frahm 1992]. Its advantage over EPI lies in the fact that it allows the acquisition of high-resolution images, whereas the resolution in EPI is determined roughly by the number of echoes which can be acquired within the T2 of brain parenchyma.
Conventional gradient-echo imaging does, however, suffer from a number of severe drawbacks. The long acquisition time per image restricts the application to a single slice and thus requires prior knowledge about the area of activation. Partial volume effects can lead to difficulties in data interpretation.
Gradient-echo techniques also are very sensitive to inflow. Since vascular flow — especially in large veins — also changes upon stimulation, this can lead to the measurement of activation effects many centimeters from the area of activation [⇒ Segebarth 1994]. These vascular signal changes can be much larger than the actual parenchymal effects, which seldom exceed 2-3%.
The image quality of all susceptibility-sensitive techniques is strongly dependent on macroscopic susceptibility problems occurring especially at soft tissue-bone-air interfaces, leading to magnetic field inhomogeneities over several centimeters.
These long-range effects will cause image distortions when occurring in the direction of the readout gradient which is normally of no practical consequence. Field inhomogeneities across the selected slice, however, will lead to signal attenuation and thus severely affect the image quality.
The use of thin slices (or 3D data acquisition) is, therefore, to be preferred for fMRI.
The strength of the stimulation effect will not be dependent on the slice thickness due to the small range of the BOLD effect (Table 11-02).
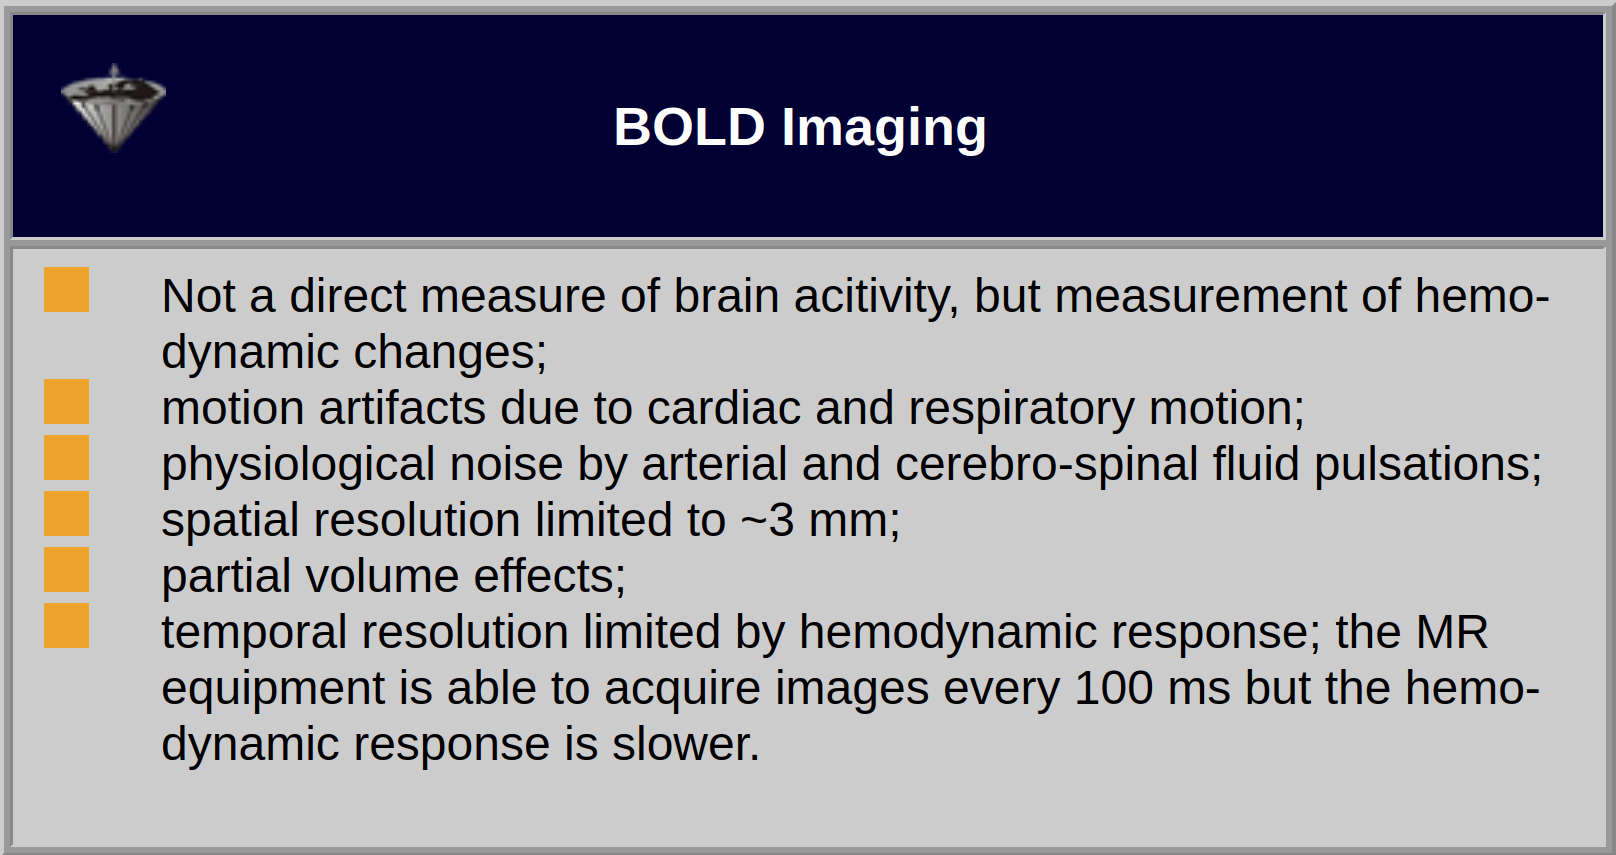
Table 11-02:
Features and limitations of monitoring of brain activity with BOLD imaging.
Applications. The first experiments performed with fMRI used the well known paradigm of photic stimulation with an alternating checkerboard pattern or a flicker display. This is known to lead to significant changes in perfusion and thus serves as a test tool for sequence development.
Meanwhile, quite a number of experiments have been performed, which led to new insights in neurocognitive research. Apart from activation in the primary visual cortex, activation of associated areas was demonstrated using a number of paradigms to test cognitive processing of motion, texture, color, object recognition, memory, sound, and others (Figure 11-14).
Various paradigms using motor activation have been successfully examined. Numerous groups have investigated language processing using a number of well established paradigms. In addition to activation of the cerebral cortex, the involvement of the cerebellum in learning tasks has been demonstrated. Subcortical activation has been found, for example, in the nucleus geniculatus (upon visual stimulation).
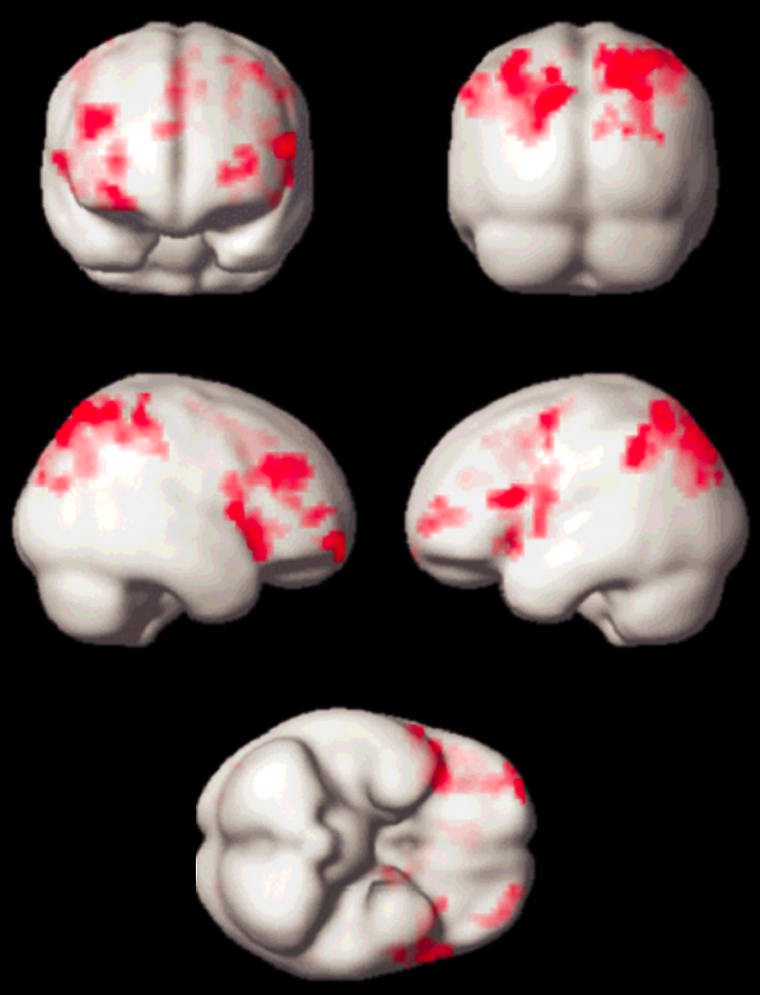
Figure 11-14:
Working memory test: typical activation pattern in the parietal cortex; cognitive / speech processing dorsolaterally.
Nomenclature. In some articles on fMRI, NMR/MRI terms are used wrongly or confusingly, for instance T1* (a term which is not appropriate; T1 is not affected by susceptibility) for an apparent T1 (Tapp or T1influx) or T2* for apparent T2 (T2app).
Critical remarks. Unfortunately, BOLD imaging at common (high and ultrahigh) fields strengths for investigative fMRI, such as 1.5 or 3.0 T, has a very low sensitivity and signal-to-noise ratio. The signal changes related to cerebral activation are close to the noise level and therefore numerous signal processing techniques are used to overcome it.
Besides, T2* to estimate blood oxygen saturation is only one singled-out factor; oxygen supply and saturation are dependent on several additional and independent parameters, among them lung and heart function, vessel size, and hematocrit. At the present stage this means that some groups look again — after the first description in 1990 by Belliveau et coll. [⇒ Belliveau 1990] — into exogenous agents, e.g., manganese, to highlight hemodynamic changes in the brain [⇒ Chen 2001, ⇒ Christen 2012, ⇒ Kim 2012, ⇒ Leite 2002] (cf. Chapter 16).
fMRI tickles the imagination of researchers, as well as the laity of all medical and paramedical disciplines including neuroeconomics and neuromarketing, and the population at large because it shows the brain at work and reacting to the environment in beautiful color images. Such applications are often doubtful. fMRI has been used and abused.
Obstacles such as high expenses, low resolution, complexity beyond the education of many users, pitfalls and snags of the technique and of the interpretation of the outcome are copious.
Commonly, BOLD data are shown coded in colors. Many users don’t really understand what the colors mean because they are not intuitive (Figure 11-15). The semiotics of the commonly used BOLD color code is red-yellow colors for increased blood volume — which attract attention — and blue-cyan for decreased blood volume which are easily put aside and overlooked. Thus, attention is commonly paid to blood flow increases but not to decreases which biases interpretation. Another problem is the lack of any standard in color schemes of BOLD studies (for details on the use of color in medical imaging (cf. Chapter 15).
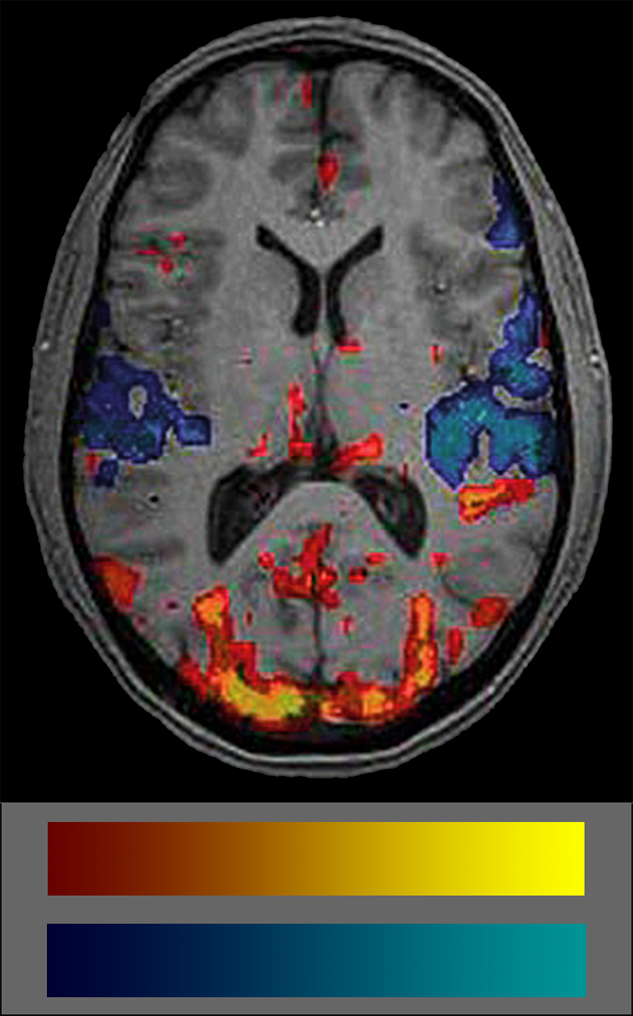
Figure 11-15:
fMRI image and color coding scale: red to yellow to indicate increased blood volume and dark blue to cyan to indicate decreases. The frequent absence of any color scale explication is a major set-back of most publications on BOLD imaging.
It is important to always keep in mind that the colored blots in BOLD images show statistical significances of blood supply, not of brain activity.
More than three decades after the pioneering work of Belliveau, Kwong and Ogawa fMRI remains an imperfect and unfinished method — that might be replaced by other, more accurate techniques in the future. It is helpful for surgical planning and has given some new insights into the physiology of cognition; however, it will not further scientific research in the understanding of the dynamics of cognition [⇒ Cohen 2012].


|

|
|---|