


 ver the years, several ideas and concepts were developed on how to influence and enhance contrast by either suppressing or highlighting certain tissue structures.
To a certain extent, these concepts have added to the diagnostic options of MR imaging and are commonly used to solve specific questions or particular research tasks (more or less similar to those in Figure 11-01).
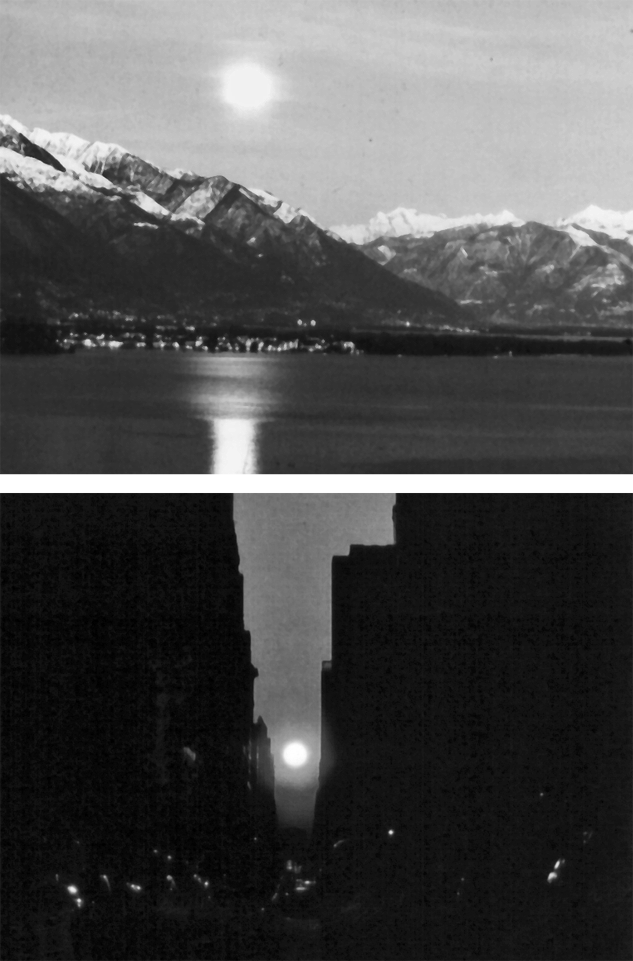
Figure 11-01:
What are the bright spots in the sky on these images: sun or moon? Think about it. Sometimes one cannot determine exactly what is seen on a picture — even when the details are clearly visible. Then, additional information or specific approaches are helpful.
Top: Moonrise in southern Switzerland.
Bottom: Sunset in Manhattan.
We will introduce some of these techniques on the following pages:
 suppression techniques;
diffusion imaging;
functional imaging;
suppression techniques;
diffusion imaging;
functional imaging;
as well as MR Elastography which is less an independent concept but rather a mechanical application.
There are a number of other 'advanced imaging' gadgets and 'apps' introduced by several manufacturers; they fulfill mostly consumerist marketing strategems or remain in the realm of constant research; they will not be discussed here.
Fat and, in a similar way, water can create contrast problems for a number of clinical issues. It possesses high signal on T1-weighted SE images, which can obscure other tissues or pathologies with high signal adjacent to the fatty tissue.
Thus, it would be of great advantage to eliminate its signal in certain cases. This includes lesions in fatty tissues such as the orbit or in examinations of fatty livers, in heart examinations, and in the differentiation of bone and marrow diseases.
We have already described two of the suppression techniques in Chapter 10: Fat and fluid suppression with STIR and FLAIR. We will discuss three different approaches below.
In Chapter 5, we have introduced chemical shift: the molecular difference between fat and water makes them precess at slightly different frequencies. If MR imaging is performed at high fields, chemical shift can lead to two different images of the same anatomical structure, which is known as chemical-shift artifact. Figure 11-02 explains the origin of this artifact.
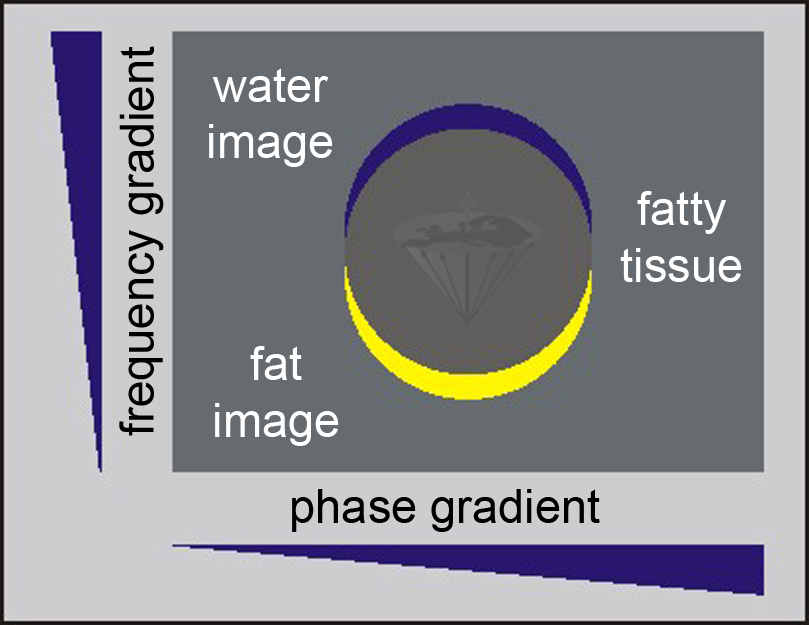
Figure 11-02:
Because of the chemical shift between water and fat signals, the image representation of fat (yellow) is shifted in the frequency encoding direction with respect to the neighboring water image (blue); in other words, there are two images from the same tissue: a chemical-shift artifact.
There is a positive side to this feature: it can be used to eliminate the unwanted fat signal. In gradient-echo sequences chemical-shift effects are not refocused and will depend on the echo time, as the following description exemplifies.
Water and fat have a chemical shift of 145 Hz at 1.0 T or of 225 Hz at 1.5 T. At the latter frequency, the off-resonance fat signal rotates through 360° every 4.4 ms.
Thus, at echo times which are even multiples of 4.4 ms, the fat and water signals are in phase, while for echo times which are odd multiples of 2.2 ms, the signals are out of phase (Figure 11-03).
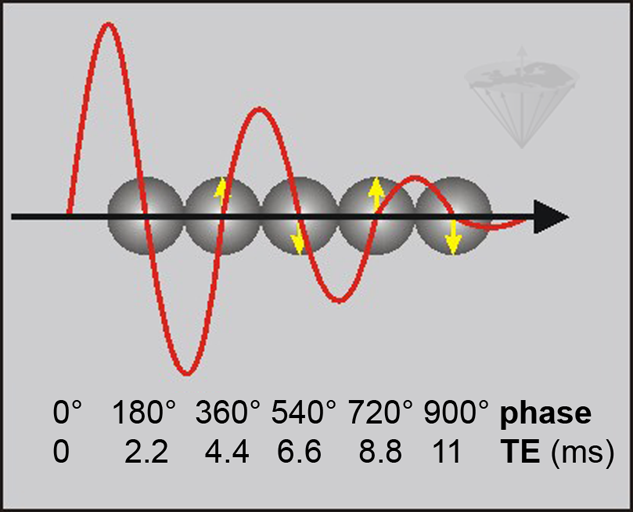
Figure 11-03:
Phase-contrast behavior at 1.5 T where the frequency difference between water and fat is 225 Hz. By choosing an appropriate TE in a GRE sequence, the fat signal is either in phase with the phase of water or out of phase. The fat signal rotates through 360° every 4.4 ms (1/225 s). This means that water and fat signal are in phase at 0.0, 4.4, 8.8, etc. ms (↑) and 180° out of phase at 2.2, 6.6, 11.0, … ms (↓).
ΔB₀ effects cause local variations in the exact phase of each component, but their phase difference is preserved.
By choosing an appropriate echo time, we can emphasize or minimize the contribution of the fat signal and by adding two averages which use in-phase and out-of-phase echo times respectively, the fat signal can be removed. This kind of fat suppression sequence is also known as the Dixon method. It is similar to chemical shift imaging or phase contrast [⇒ Dixon 1984, 1985, ⇒ Szumowski 1988].
By applying an RF pulse of the appropriate frequency before the regular imaging pulse sequence, one can eliminate the signal of a specific tissue. Again, this method is field strength-dependent and best used at high fields where water/fat shifts are high.
A presaturation pulse is applied at the precession frequency of fat (or the compound to be saturated); this pulse does not influence the water component of the tissue (Figure 11-04).
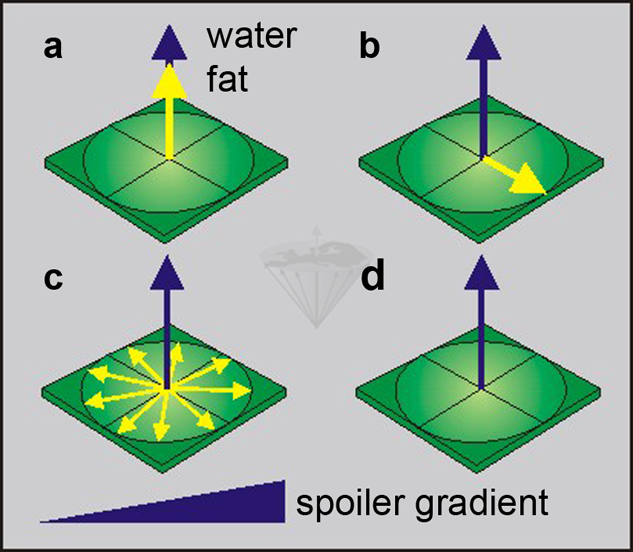
Figure 11-04:
Selectively saturating the fat component:
(a) a fat-saturating RF pulse is transmitted, and
(b)rotates the yellow fat magnetization into the transverse plane.
(c)The fat spins start dephasing in the x-y plane, accelerated by a dephasing gradient.
(d)Only the blue water magnetization remains.
Usually a chemical-shift selective pulse sequence (CHESS) or a variation of this sequence are used. With a frequency-selective 90° pulse, the magnetization of fat is rotated into the transverse plane where its dephasing is accelerated by a spoiler (or crusher) gradient. Then the regular pulse sequence follows, but it only excites the water in the sample.
Figure 11-05 shows an example of the application of fat suppression. A different kind of presaturation is used for artifact suppression in flow imaging (see Chapter 17).
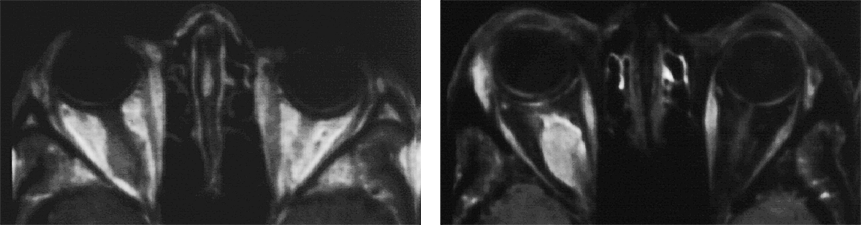
Figure 11-05:
Example of fat suppression — tumor in the right orbit. T1-weighted SE images.
Left: Plain image.
Right: Contrast enhancement of the tumor after gadolinium contrast agent. The tumor has become bright. The fat signal has been eliminated; both orbits now are dark and the enhancing parts of the tumor are easily delineated.
The idea of altering contrast by off-resonance irradiation of the sample was first described by Muller and collaborators in 1983 [⇒ Muller 1983]. Wolff and Balaban coined the term magnetization transfer (magnetization transfer contrast = MTC) for this kind of alteration of image contrast [⇒ Wolff 1989]. Lipton, Sepponen and collaborators improved contrast enhancement of the method [⇒ Lipton 1991].
MTC is a suppression of protein-bound water and related to spin-lock imaging. It is based on the fact that in most biological tissues there is a cross relaxation between the free proton pool Hf representing mobile water protons and the restricted proton pool (Hr) representing the protons associated with macromolecules or immobile water [⇒ Edzes 1978].
The restricted Hr pool has a much shorter T2 than the mobile Hf pool, and consequently is not directly observed with standard MR techniques.
Thus, its influence upon image contrast cannot be exploited with standard pulse sequences. The cross relaxation and/or chemical exchange between these two pools means that saturating the resonance corresponding to one of them also affects the second pool (Figure 11-06).
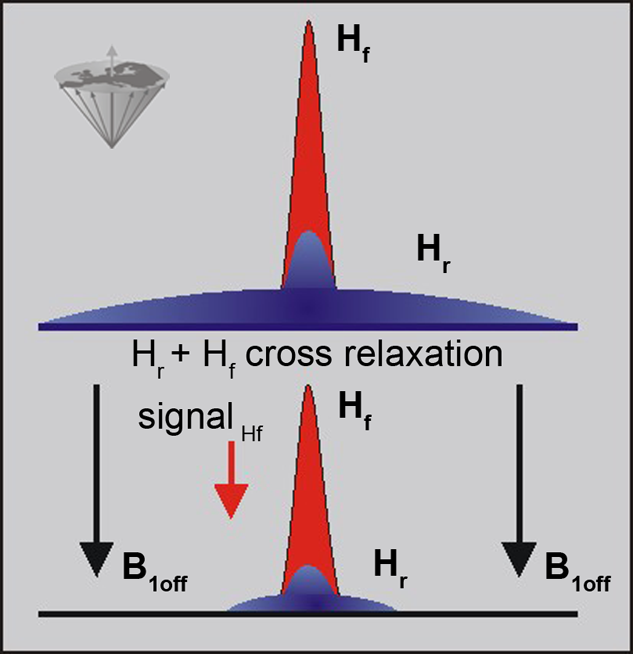
Figure 11-06:
The signal in a conventional MR examination consists of the part created by the narrow peak of the mobile protons (free protons: Hf) and the broad peak of the immobile protons (restricted protons: Hr). Both pools interact and exchange information. The restricted pool can be saturated by off-resonance irradiation, which reduces its magnetization to 0 (in the best case). The exchange between the two pools then leads to a reduction in the free water signal.
Saturating the Hr pool leads to a loss of signal from the Hf pool.
The cross relaxation is a short range process and, therefore, the direct effect is limited to interfaces between the two pools, although diffusion relays the effect to the bulk of free water.
The Hr pool is known to have a very short T2 value; thus, the behavior of the magnetization during the RF pulse is dominated by relaxation.
The majority of sequences developed to date for MTC imaging use a relatively long, low-power, off-resonance saturation pulse to selectively saturate Hr [⇒ Jones 1991, ⇒ Wolff 1989].
However, new pulse sequences have been proposed to optimize MTC [⇒ Jones 1992].
The clinical applications of MTC are limited; it can be used in time-of-flight MR angiography to suppress background tissue. In T2-weighted images, MTC may help to detect early demyelination.
A combination of MTC and contrast agent application enhances contrast at times where one of the techniques alone does not create sufficient enhancement, for instance in some cases of multiple sclerosis and other brain lesions, of brain infarctions, and in the detection of recent myocardial infarctions (Figure 11-07) [⇒ Jones 1993, ⇒ Tanttu 1992].
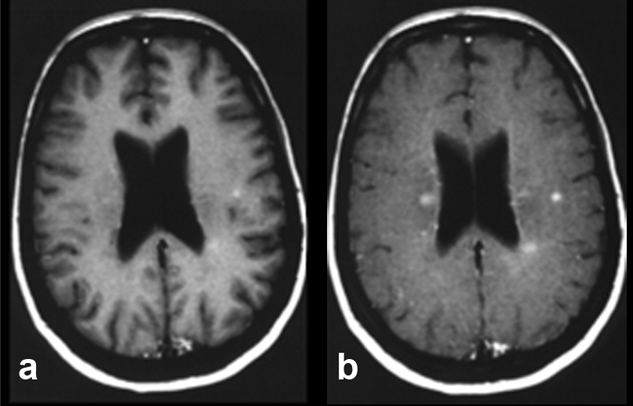
Figure 11-07:
Example of magnetization transfer contrast. Patient with multiple sclerosis.
(a) T1-weighted brain images after enhancement with a gadolinium-based contrast agent.
(b) Image with additional magnetization transfer contrast. The combination of contrast agent and MTC clearly enhances contrast and shows more lesions, although it remains unclear whether all of these lesions are active.


|

|
|---|