


![]() n order to process the time series (= the series of images starting with one or several precontrast images followed by the contrast-enhanced images) on a pixel-by-pixel basis, the spatial location of picture elements within the image matrix must be exactly the same. In many instances, this is not the case due to movement (Figures 16-02 and 16-03).
n order to process the time series (= the series of images starting with one or several precontrast images followed by the contrast-enhanced images) on a pixel-by-pixel basis, the spatial location of picture elements within the image matrix must be exactly the same. In many instances, this is not the case due to movement (Figures 16-02 and 16-03).
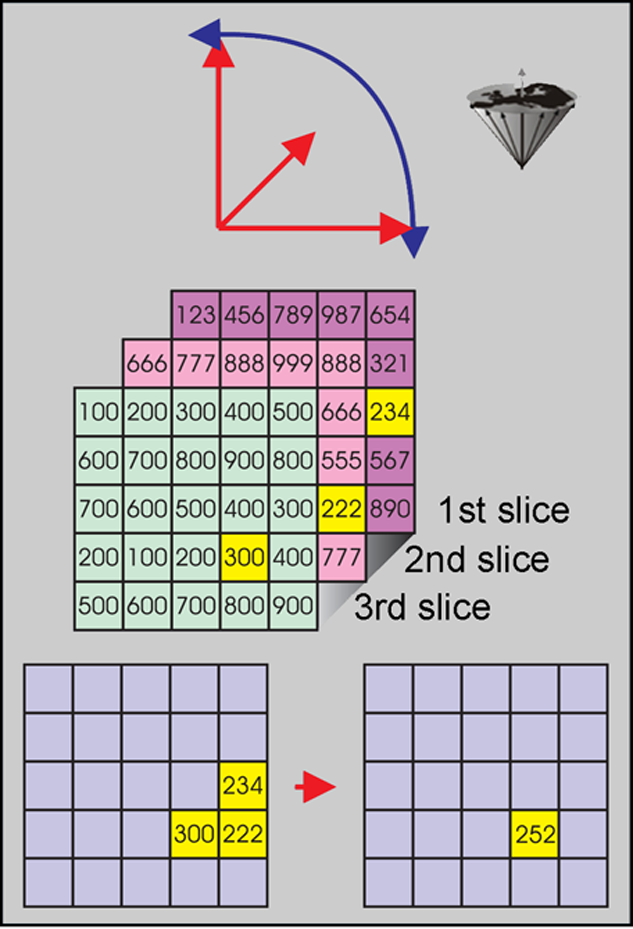
Figure 16-02:
Top: Organs in the human body may move in all three dimensions and rotate at the same time.
Center: Thus, multichannel images can easily be out of alignment due to motion and rotation.
Bottom: Pixels have to be realigned for image-processing and analysis. Anatomically, the yellow pixels correspond to the same voxel, but have a different location on the slices.
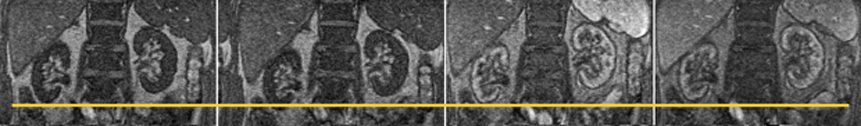
Figure 16-03:
Four images taken out of a dynamic study of the kidneys. During the examination, both kidneys move in all three dimensions and rotate. In this example, the right kidney moves several pixels up and down during the time series (yellow line). Mathematical processing of the images can help eliminate some of the movement and facilitate processing the time series.
This hampers the calculation and evaluation of time intensity curves and parametric images [⇒ Gehrig 1991]. Pixels or regions-of-interest have to be reallocated manually or, preferably, automatically, e.g., by contour recognition. The realignment of the images is often referred to as image registration.
This problem is even more complicated in contracting organs such as the heart [⇒ Higgins 1996]. Here artifacts can be corrected by highlighting the edges of the organ by drawing the boundaries either manually, semiautomatically or automatically if there is some a priori knowledge, e.g., previous knowledge of the outline of the organ and the ratio between its length and width (Figure 16-04) [⇒ von Schulthess 1991]. A more sophisticated approach is the automatic creation of regions of interest (auto-ROIs) [⇒ Torheim 1997].
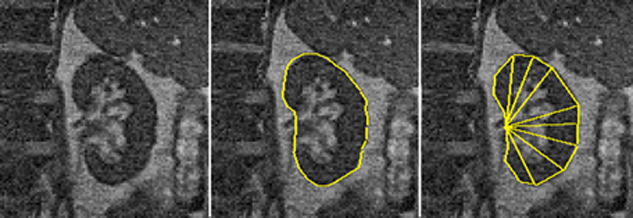
Figure 16-04:
Left: A reference image is selected.
Center: The boundaries of the kidney can be manually drawn and adjusted in each image of the examination series.
Right: An edge-detection program can define the boundaries through contour-enhancement and automatically or semiautomatically adjust them by comparing the ratios between fixed parameters.
 Image registration of contrast-enhanced images of non-rigid organs is a difficult problem due to the changes not only in contrast but also in the structures visible.
Whereas rigid organs like the brain can be aligned by performing translations and rotations, non-rigid require non-rigid reformations, which potentially can change the structures to be observed.
An additional problem is the propagation of mistakes, for instance through artifacts which are not recognizable any more on processed images. They can be caused by a change of relative or absolute signal intensity on the image influenced by outside factors such as surface coils.
Furthermore, due to the frequent presence of time constraints, the signal-to-noise ratio is often quite low in dynamic contrast-enhanced MR imaging.
This necessitates the need for noise-reduction techniques which are commonly performed by applying so-called filters either in the spatial (image) or in the temporal domain [⇒ Sebastiani 1996].
In the meantime there are some filters which can remove noise in a way which was previously only possible by increasing the magnetic field strength or improvements in the amplifiers or other hardware.


|

|
|---|