


 or a long time, one of the main objectives researchers wanted to achieve was the improvement of MR image contrast by means of possible electronic contrast agents without the application of any exogenous medium. Today these methods are also known as fingerprinting or biomarkers (see also Chapter 4).
Pure relaxation-time images and, at a later stage, segmented images were the first research targets of this kind of MR image-processing.
However, this notion of the existence of electronic contrast agents that can be employed to highlight pathologies through image-processing derives from a wrong hypothesis, namely that there is hidden information about tissue structures or processes in the original images or raw data.
The additional information given by a pharmaceutical contrast agent, i.e., vascularity, membrane permeability, etc., is not given by any plain imaging modality and therefore cannot be electronically enhanced; if the contrast-to-noise ratio is zero in the raw data, no contrast enhancement by image-processing will be possible.
 On the other hand, it might be possible to enhance minimum quantities of contrast agent uptake, which create only minor contrast changes if appropriate image processing techniques are applied.
Since the temporal uptake pattern of contrast agents in vivo can vary between healthy and diseased tissue, differences in uptake can be of diagnostic value. In signal intensity-versus-time curves, some lesions reveal steeper slope, higher maximum signal intensity, and faster wash-out of the contrast agent than the surrounding tissue [⇒ Gribbestad 1994, ⇒ Kaiser 1990, ⇒ Tofts 1991].
A factor contributing to the uncertainty of quantitative data acquired with dynamic images is the wide scatter of blood volumes and transit times in different organs, or even within similar organ structures.
In the brain, blood volumes and transit times tend to be higher in the pons, cerebellum, and medulla than in the midbrain and forebrain, which suggest some general regional differences in microvascularity [⇒ Nakagawa 1995]. These differences can be substantial and may overlap with the values of pathologies. Proper knowledge of the normal range of anatomy and physiology is essential for the final assessment of data or calculated parametric images.
As a supplement and replacement of analog contrast-enhanced cine fluoroscopy, dynamic digital imaging to highlight these additional contrast parameters was developed for nuclear medicine and CT. Dynamic PET scans for regional cerebral blood flow measurements, for instance, can be performed at intervals of several seconds. However, radioisotope methods lack good temporal and spatial resolution, whereas CT is fast and shows anatomical structures in detail.
Conventional MR imaging is a slow imaging technique (Figure 16-05). All of the classical imaging sequences have long examination times. In the late 1980s rapid imaging pulse sequences became available. They made it possible to follow the dynamic signal-intensity changes after contrast agent injection.
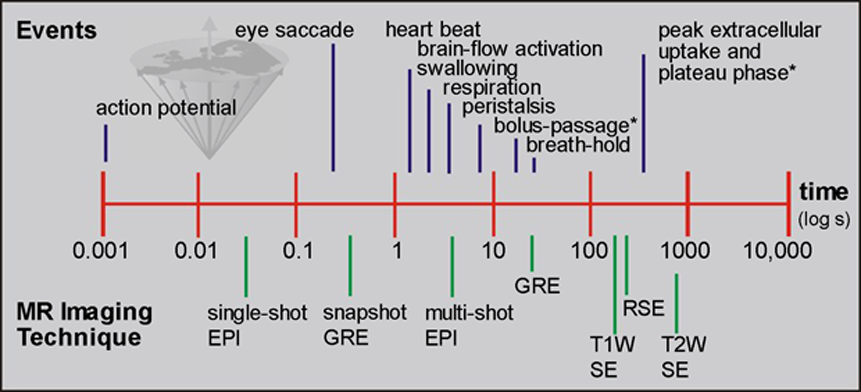
Figure 16-05:
A graphic depiction of the time scale of different events in man versus MR imaging methods. Imaging speed must be 3-10 times faster than the event to be monitored or avoided.
* = of contrast agent.
The prerequisite of sufficient spatial and time resolution was given with rapid imaging, and the uptake of contrast agents could be readily monitored by MR imaging (cf. bolus injection in CE-MRA).
Maximum vascular concentration of an ECF-space contrast agent will occur during the first pass through the body in the vascular phase. Maximum tissue concentration, as well as enhancement rate and onset, depend on a number of not yet completely understood factors such as vascularity, membrane permeability, and leakage of the blood-brain or the tumor barrier, and venous outflow.
Thus, maximal tissue concentration may occur between several seconds and minutes after the injection of the contrast agent (Figure 16-06). The agent then diffuses into the extracellular space until an equilibrium is reached during the plateau phase.
Concentration decreases during the wash-out phase which follows.
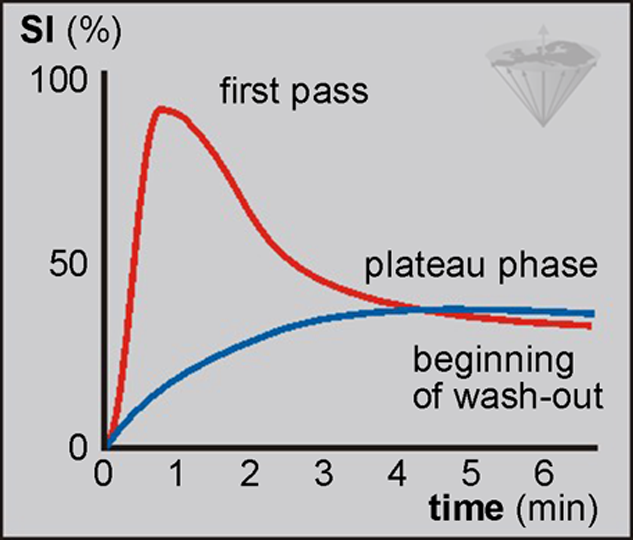
Figure 16-06:
Bolus injection of contrast agent: rapid intravascular uptake after bolus injection leading to first-pass phenomenon versus relatively slow extracellular uptake in easily accessible regions.
SI = signal intensiy.
The enhancement processes can be monitored by time-intensity curves. Although both the vascular and the extracellular phase of uptake go hand in hand, one must distinguish monitoring the dynamic signal-intensity changes of the first pass of a contrast agent bolus such as in brain and heart imaging and the slower tissue uptake as it is commonly done in breast lesions.
The time resolution required to study the dynamics of the contrast agent uptake in an organ depends on the requirements of the individual investigation. Better time resolution will improve the characterization of the bolus while passing through the body region-of-interest, in particular if these images are to be treated by mathematical techniques to analyze bolus behavior [⇒ Jones 1993].
Such mathematical treatment that, at the end, can lead to parametric images is beyond the capability of the human brain, which is unable to make a correlation if the number of features exceeds three.
Such differences can only be distinguished either by a qualitative description of the change in signal intensity observed over time or by the quantification of all available or certain selected parameters by fitting the concentration-time course to a pharmacokinetic model [⇒ Larsson 1994, ⇒ Tofts 1991].
Explanations of the parameters are given in Figure 16-07, and an overview of qualitative or semi-quantitative parameters commonly determined by time versus intensity curves is given in Table 16-02.
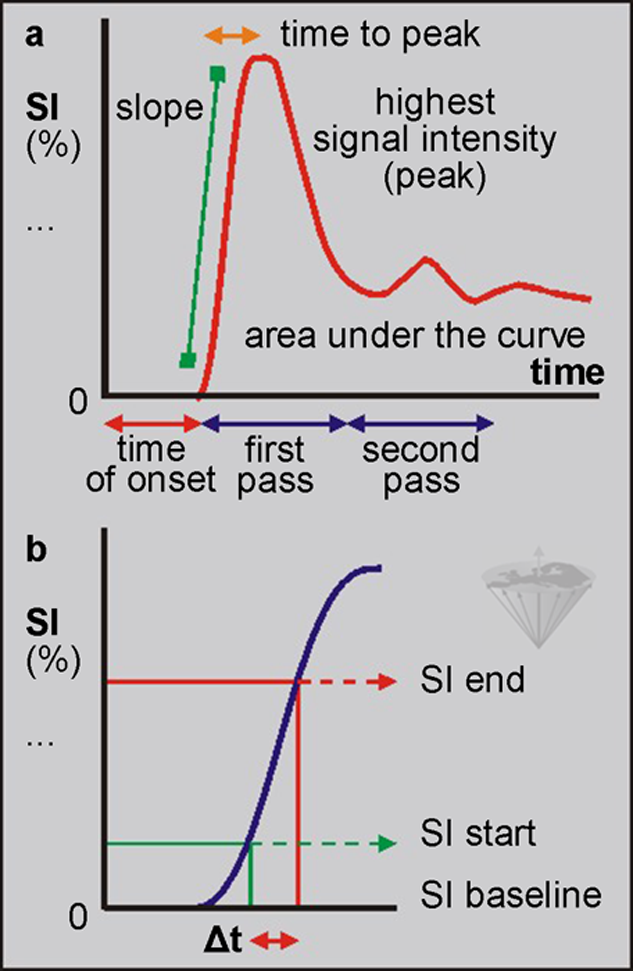
Figure 16-07:
Parameters of bolus injection of a T1 contrast agent. The maximum wash-in slope is considered one of the most important parameters, indicative of, e.g., tumor vascularity. It can be calculated as follows: (SIend - SIstart / SIbaseline × Δt) × 100 [% / s].
SI = signal intensiy.
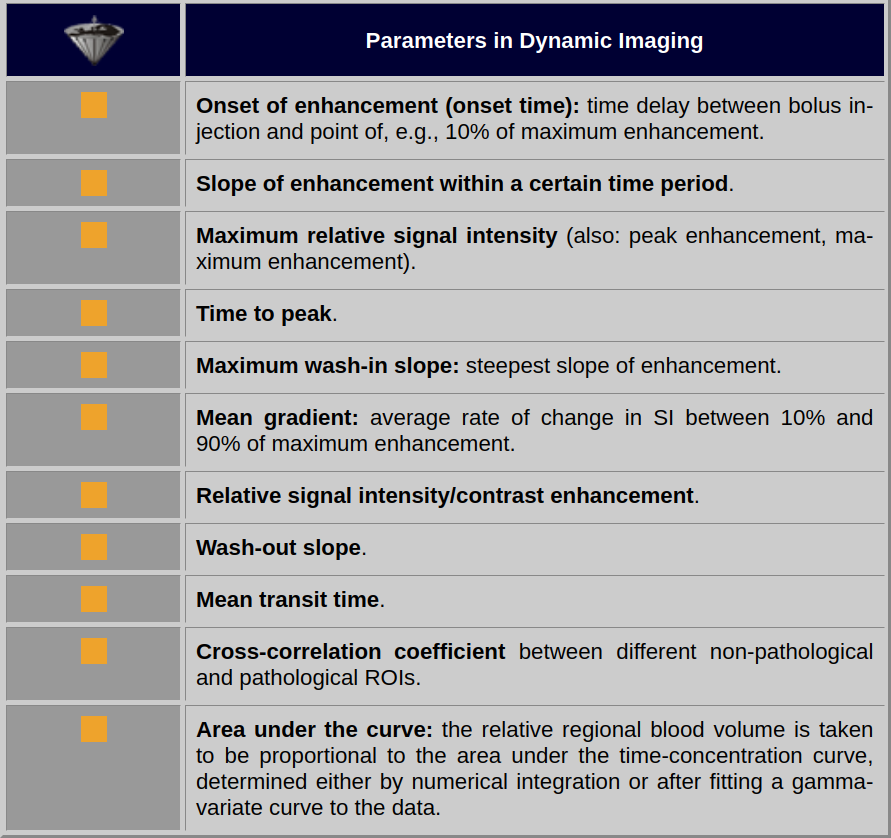
Table 16-02:
Some parameters in dynamic imaging. Note: there is no general agreement on terms and nomenclature — and there is no agreement on the diagnostic implication of these parameters.
A number of software systems offer an integrated, standardized way of performing both image processing and image analysis on all kinds of dynamic images independent of the imaging equipment on which the images were acquired in a standardized way [⇒ Torheim 1997, 1999].
In this context, it is important to remember that MR imaging has no standard units for signal intensity: it cannot be measured in units comparable to Hounsfield units in CT. Several attempts have been made to create a quantitative scale, but none of these methods creates an absolute standard.
Thus, curves depicting signal intensity versus time remain only qualitative representations of contrast passage through tissues.
To acquire quantitative data, concentration versus time curves have to be fitted by the principles of tracer dilution kinetics. Time-intensity curves of bolus injections have to be corrected, i.e., cleaned of the influence of recirculation to achieve better raw data for parameter calculation, e.g., by gamma-variate fitting [⇒ Gonzalez 2008, ⇒ Sebastiani 1996, ⇒ Thompson 1964].
The concentration (C) of the contrast agent in each pixel, at each time point, can be calculated from the known relaxivity of the contrast agent and the respective relaxation times, T1 and T1₀:
where R1 = 1/T1 at the measured point during the dynamic study, R1₀ = 1/ T1₀ prior to injection, and r1 is the longitudinal relaxivity of the contrast agent at the given magnetic field strength and 37° C.
The resulting concentration-time curves can be fitted to pharmacokinetic models.
From this, values of permeability and leakage volume are derived. For extended image processing and data analysis, independent software systems running on personal computers have been developed.


|

|
|---|